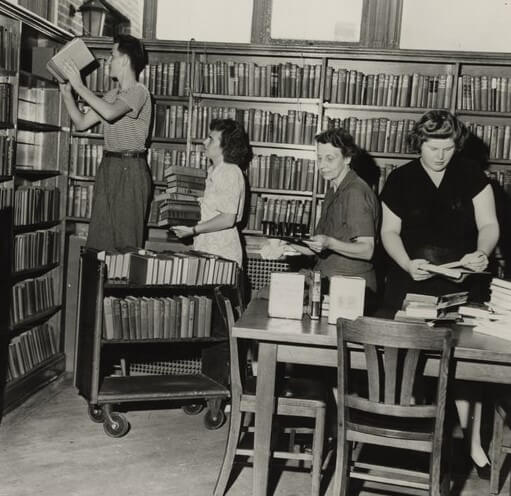
My Journey Learning R as a Humanities Undergrad
Discover how I learned R programming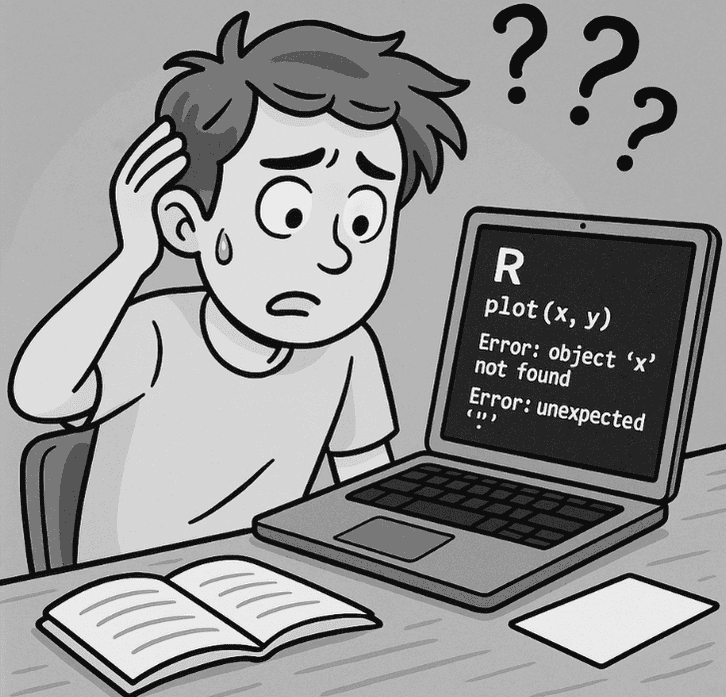
.")
Dive into our R and Python programming lessons, sharpen your analytical skills, and bring your insights to life with in-depth analyses and effective visualizations. Whether you are conducting historical research or you are an enthusiast eager to expand your knowledge base, here is the place where you transform your perspectives with the power of data science.