Exploring the MET API with Python - Francisco Goya's Artworks
Learn how to use Python to access the Metropolitan Museum of Art (MET) API and explore Francisco Goya's artworks.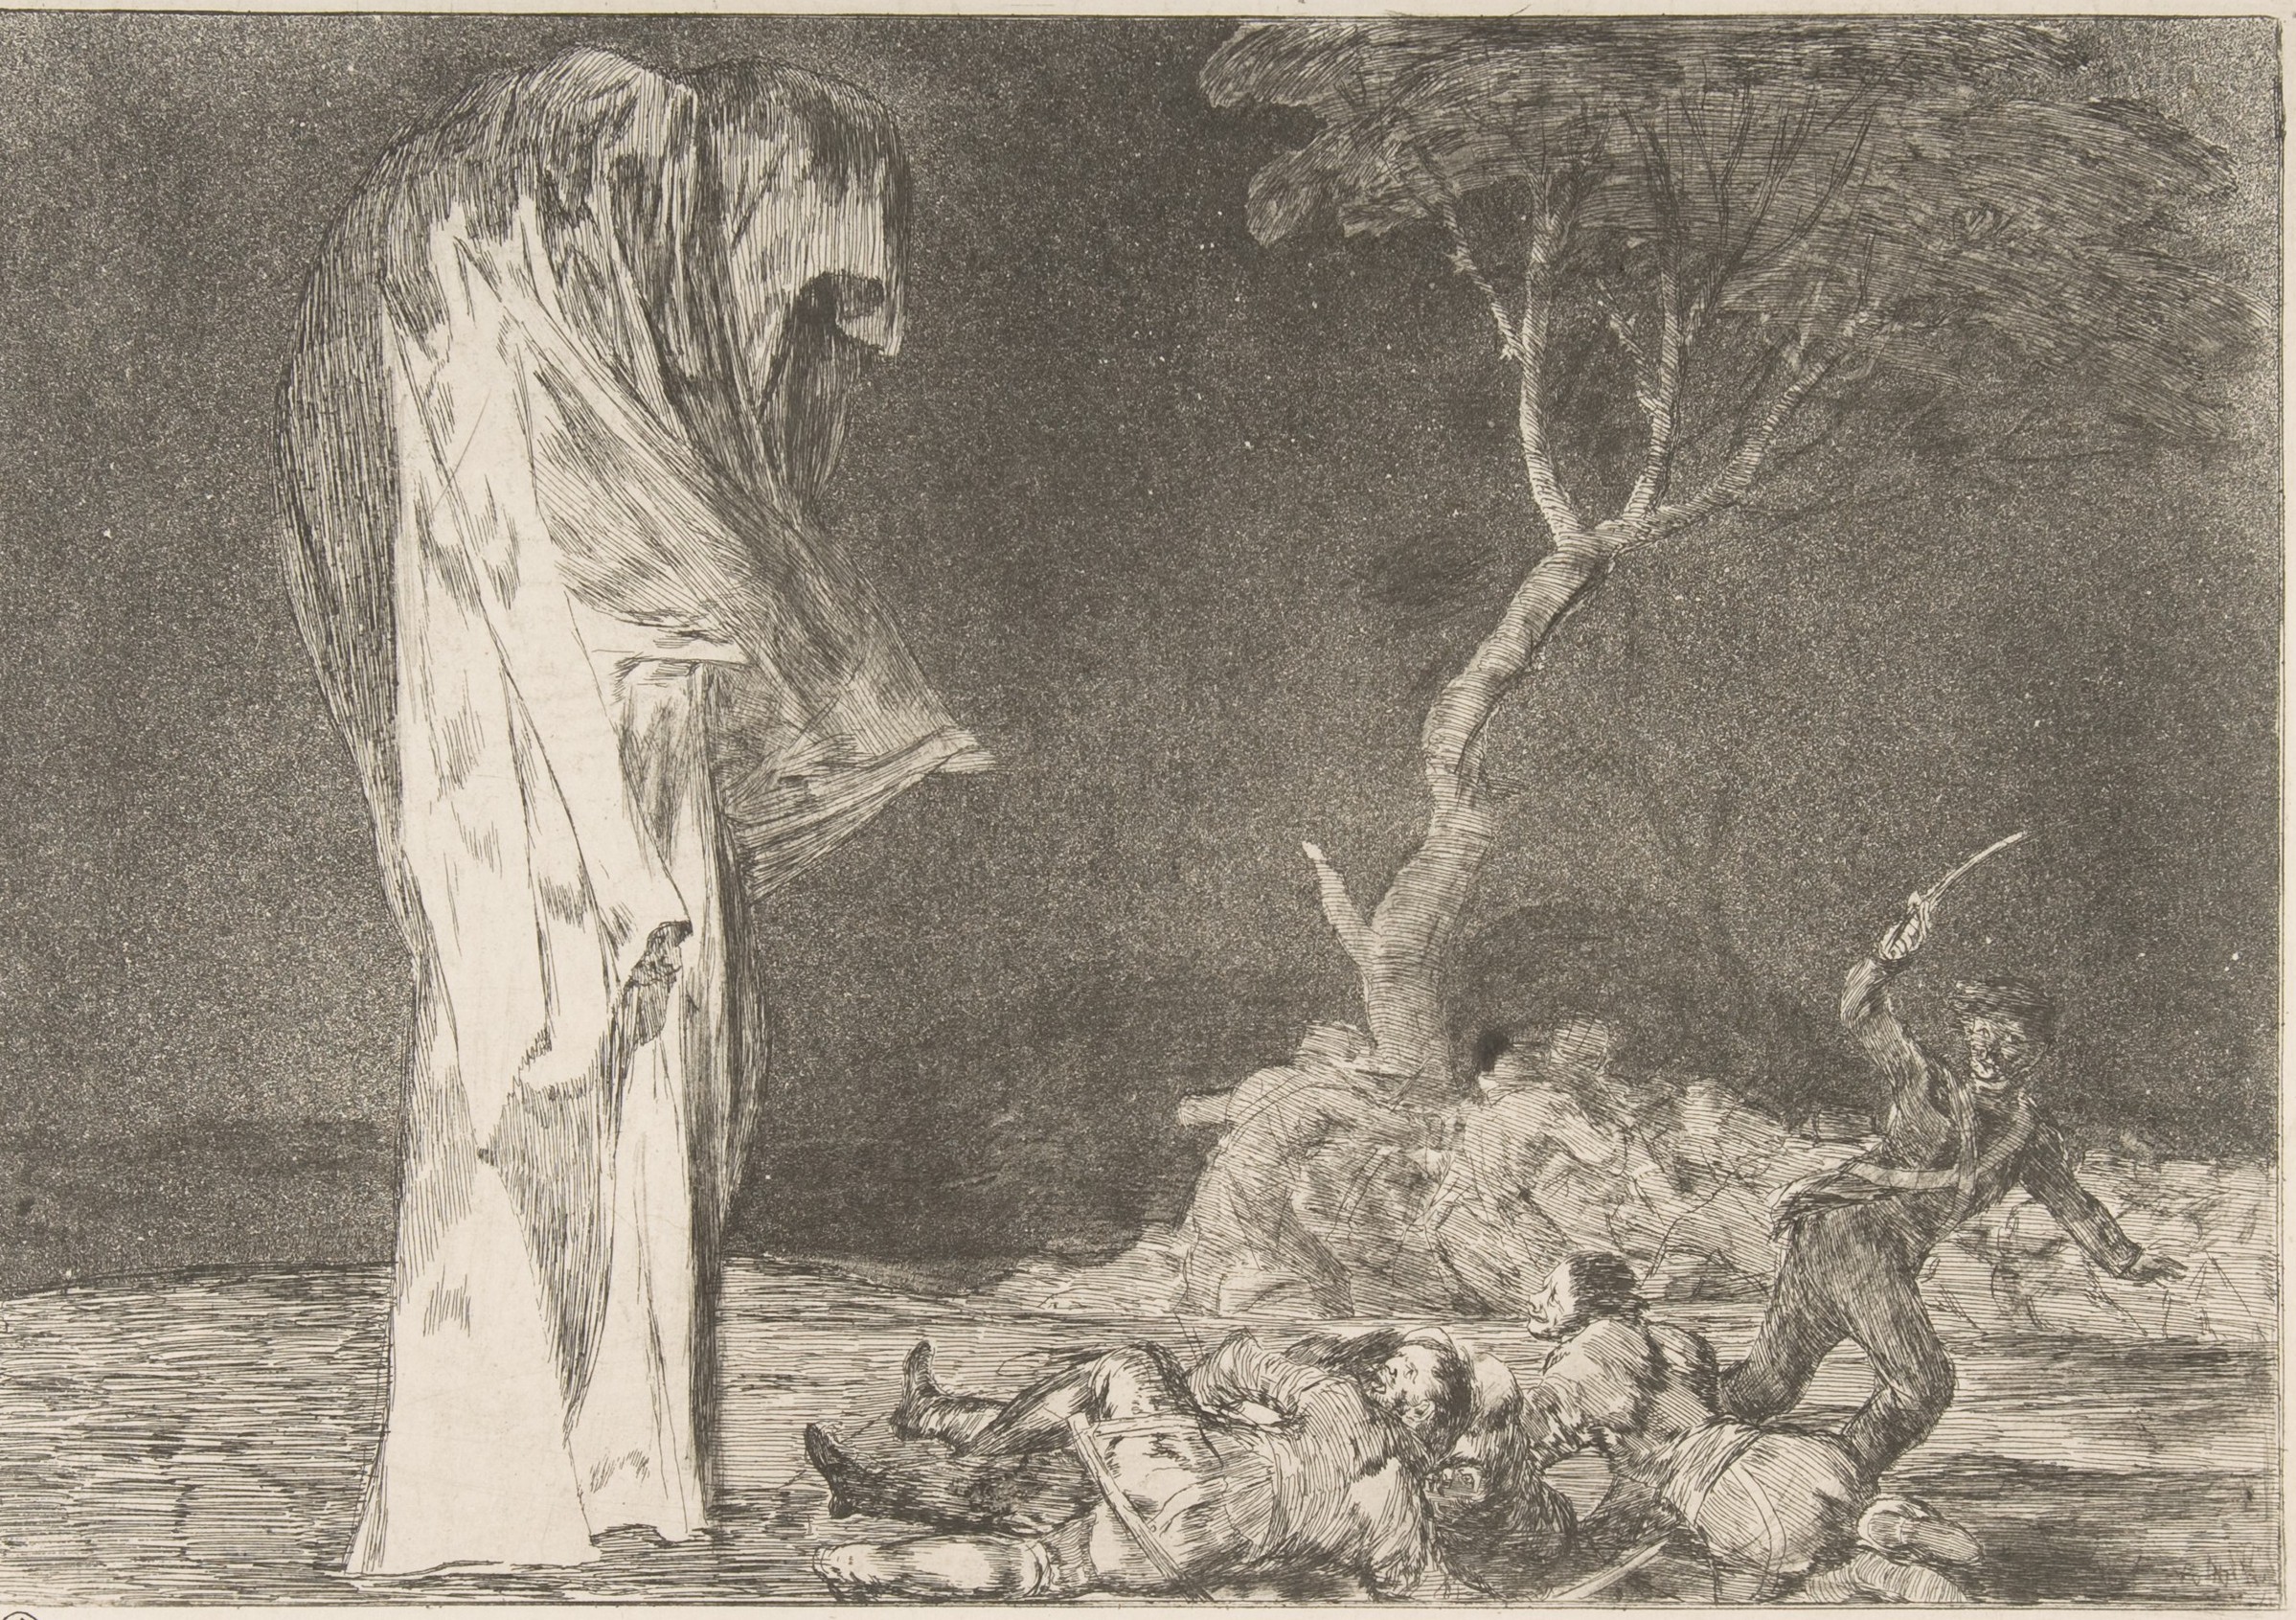
.")
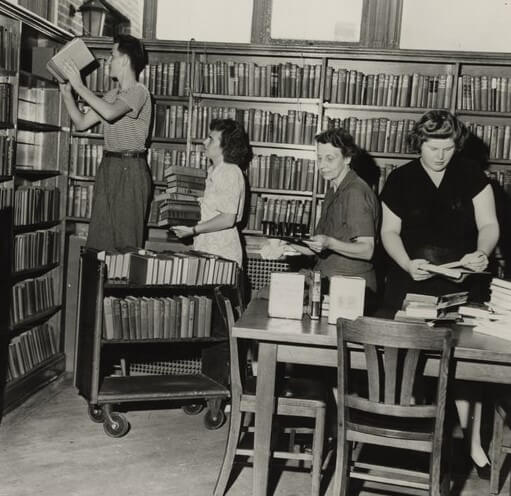
Women reprogramming the ENIAC (1946). Wikimedia, Public Domain.
Here you find lessons to sharpen your coding skills, while learning about our past. Whether you are conducting research or you are a data enthusiast, here is the place where you transform your perspectives with the power of data! Select a topic in the menu below and starting learning!