Discovering historical datasets for your research
What you will learn
- Get to know good sources of historical data;
- Be able to load data in R and Python;
Table of Contents
- Introduction
- Historical Data in Research - Where to find?
- Coding the past: how to load data in Python
- Coding the past: how to import a dataset in R
- Conclusions
Introduction
‘Information is not knowledge’
Albert Einstein
With so much data available nowadays, I frequently feel overwhelmed when I have to find data to study a subject. Is this dataset reliable? How was the data treated? Where can I find the codebook with detailed information on the variables? These are only some of my concerns. When it comes to historical data, the task can be even harder. In this lesson, you will learn about fascinating and reliable websites to find historical data for your research. Moreover, you will learn how to load data in Python and R.
Historical Data in Research - Where to find?
1. Harvard Business School
The Harvard Business School developed the project ‘Historical Data Visualization’ to foster the understanding of global capitalism throughout time. The page offers more than 40 datasets about a broad range of topics. For instance, you can find data on life expectancy, literacy rates or economic activity in several countries during the 19th and 20th century. Datasets are mostly in Excel format. Definitely worth a visit!
2. Human Mortality Database
Human Mortality Database (HMD) provides death rates and life expectancy for several countries over the last two centuries. Even though the platform requires a quick registration to give you access to the data, it is very complete and straightforward to understand. Datasets are in tab-delimited text (ASCII) files.
3. National Centers for Environmental Information
Would you like to study how climate has changed over the last centuries? Then this is an invaluable source for you! The National Centers for Environmental Information is the leading authority for environmental data in the USA and provides high quality data about climate, ecosystems and water resources. Data files can be downloaded in comma separated values format.
4. Clarin Historical Corpora
If you wish to work with text data, this is a valuable source of material. It offers access to ancient and medieval greek texts, the manifests wrote during the American Revolution, court proceedings in England in the 18th century and many other instigating materials. Files are usually provided in .txt format. The requirements to access files varies according to each case, since data comes from different institutions.
5. Slave Voyages
This impressive platform, supported by the Hutchins Center of Harvard University, gathers data regarding the forced relocations of more than 12 million African people between the 16th and 19th century. Files are provided in SPSS or comma separated values format.
6. HistData Package
This source is not actually a website but an R package. It provides a collection of 31 small datasets relating to several historical events over the last centuries. The package seeks to bridge the realms of history and statistics, offering tools to analyze historical problems and questions with statistical rigor. The Guerry dataset, for instance, provides social data from the 1830s French departments. Nightingale details the monthly number of deaths from various causes in the British Army during the Crimean War (1853-1856). There is a whole lesson about this package. Check it out: ‘Uncovering History with R - A Look at the HistData Package’
Coding the past: how to load data in Python
1. Pandas read_csv()
In this section, you will learn to load data into Python. You will be using data provided by the Slave Voyages website. The dataset contains data regarding 36,108 transatlantic slave trade voyages. Learn more about the variables here.
To load our data in Python, we will use Pandas, a Python library that provides data structures and analysis tools. The Pandas method read_csv() is the ideal option to load comma separated values into a dataframe. A dataframe is one of the data structures provided by Pandas and it consists of a table with columns (variables) and rows (observations). Bellow, we use the default configuration of read_csv() to load our data. Note that the only parameter passed to the method is the file path where you saved the dataset.
content_copy Copy
import pandas as pd
df = pd.read_csv("/content/drive/MyDrive/historical_data/tastdb-exp-2019.csv")
2. Getting pandas dataframe info
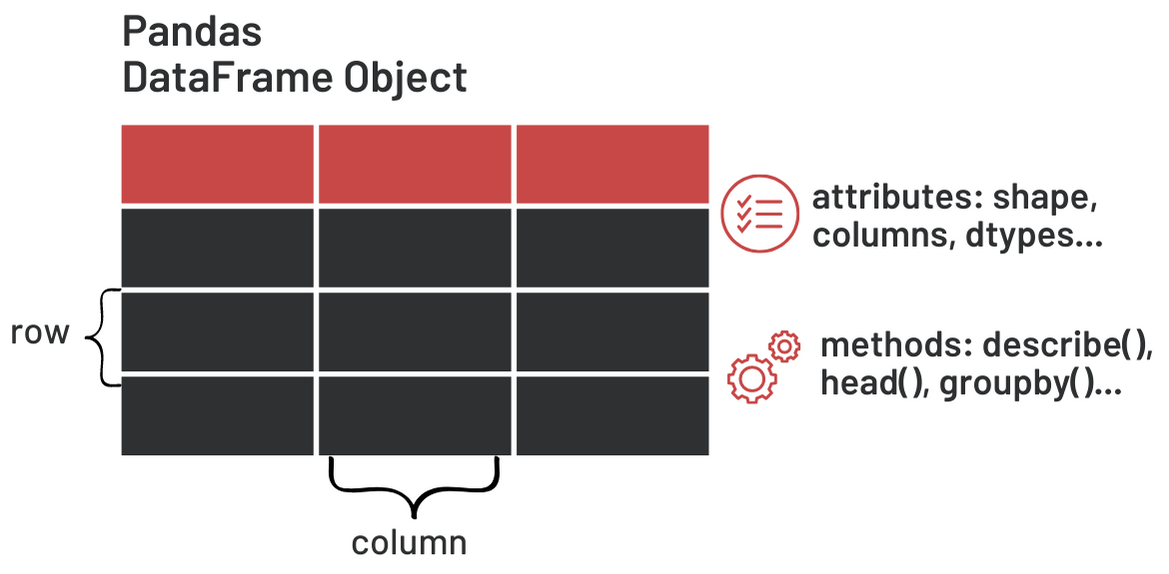
A dataframe object is now created. It has several attributes or characteristics. For example, we can check its dimensions with shape and its column names with columns. Note that column names are the names of our variables. Moreover, you can also call methods, which, in general, carry out an operation to analyze the data contained in the dataframe. For example, the method describe() calculates summary statistics of each variable and head() filters and displays only the first n observations of your data. Check all Pandas DataFrame attributes and methods here.
Use the following code to check the dimensions and variable names of the dataset:
content_copy Copy
print("Dimensions: ", df.shape,
      "Variable names: ", df.columns)
The attributes show that there are 276 variables and 36,108 observations in this dataset. Let us suppose you are only interested in the number of slaves disembarked (slamimp) in America per year (yearam). You could load only these two variables using the read_csv() parameter usecols. This parameter receives a list with variable names you wish to load. In larger datasets this parameter is very handy because you do not want to load variables not relevant to your study.
content_copy Copy
df = pd.read_csv("/content/drive/MyDrive/historical_data/tastdb-exp-2019.csv",
                 usecols=['YEARAM', 'SLAMIMP'])

df.head()| SLAMIMP | YEARAM | |
|---|---|---|
| 0 | 290.0 | 1817 |
| 1 | 223.0 | 1817 |
| 2 | 350.0 | 1817 |
| 3 | 342.0 | 1817 |
| 4 | 516.0 | 1817 |
Now the dataframe is loaded only with the two specified variables. As said, Pandas dataframes offer tools to analyze the data, using DataFrame methods. Above, we use the method head() to display the five first observation in our dataframe. You can set how many observations head() should return through the n parameter (default is 5).
Moreover, we can use describe() to obtain summary statistics of our variables. From the summary statistics we can see that the earliest record is from the year 1514 and the latest one of 1886. Also, the maximum number of slaves traded in one voyage was 1,700.
| SLAMIMP | YEARAM | |
|---|---|---|
| count | 34182.00 | 36108.00 |
| mean | 269.24 | 1764.33 |
| std | 137.32 | 59.47 |
| min | 0.00 | 1514.00 |
| 25% | 177.00 | 1732.00 |
| 50% | 261.00 | 1773.00 |
| 75% | 350.00 | 1806.00 |
| max | 1700.00 | 1866.00 |
Coding the past: how to import a dataset in R
In R there are several functions that load comma separated files. I chose fread from the data.table library, because it offers a straightforward parameter to select the variables you wish to load (select). fread creates a data frame, similar to a pandas dataframe.
content_copy Copy
library(data.table)

df <- fread("tastdb-exp-2019.csv",
            select = c("YEARAM","SLAMIMP"))
To get summary statistics about your variables you can use the function summary(df). To view the n first observations of your dataframe, use head(df,n) as shown bellow. Summary and head produce very similar results to describe and head in Python.
content_copy Copy
summary(df)

head(df,10)
More posts on how to find reliable data will be published soon!
Conclusions
- Data analysis in historical research is becoming more and more popular. These websites offer high quality historical data for your analysis:
- You can load comma separated values in Python with the pandas method
.read_csv(); - You can load comma separated values in R with the function
fread()from the librarydata.table;
Comments
There are currently no comments on this article, be the first to add one below
Add a Comment
If you are looking for a response to your comment, either leave your email address or check back on this page periodically.